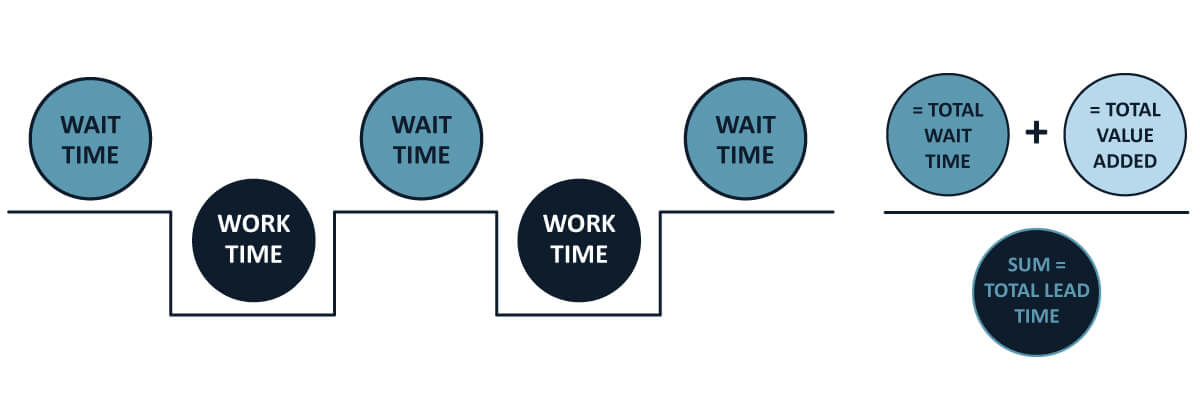
Flow efficiency is a metric with lean origins, exploring the difference between productive ‘work time’ and non-productive ‘wait time’ (waiting for approval, resources, etc.).
In lean process optimisation, a lead time ladder is used to identify the activities in a value stream which add value to the end product, and potential waste in the process where value is not being added (hand-offs, queues, transport, etc.).
The lead time ladder helps with system improvement. Investment in optimising the performance of activities that add value tends to yield less benefit than investment in reducing waste.
For instance, you can get a significant lead time reduction by reducing an approval cycle from two weeks to one week without a great deal of investment. To get the same sort of system benefit from optimising an activity like requirements analysis, development or testing would take considerable time and money.
Flow efficiency analysis builds on the lead time ladder concept and gives a simple metric (%) to describe the relationship between value add time versus potential waste. It’s one of the richest metrics available and is relatively simple to capture.
Flow efficiency calculations
Step 1. We measure the average lead time for pieces of value that go through the system, looking at either Customer Lead Time or System Lead Time:
Customer Lead Time is measured from the point when we commit to deliver something, until the point at which it is delivered.
Time can be recorded in a few ways:
- In systems development life cycle (SDLC) the clock starts ticking once we enter change control (e.g. business case approval or requirements sign-off) and stops when we deliver into production.
- In a Kanban system the clock starts ticking when the item is selected and stops when we deliver the item into production.
- In a Scrum team the clock starts ticking when the story is added to the sprint backlog and stops when we deliver into production.
System Lead Time is measured with the same starting point, but we stop the clock when the work leaves the control of the system (e.g. when it hits an unbound buffer in Kanban or when it hits a centralised integration and release management process in SDLC).
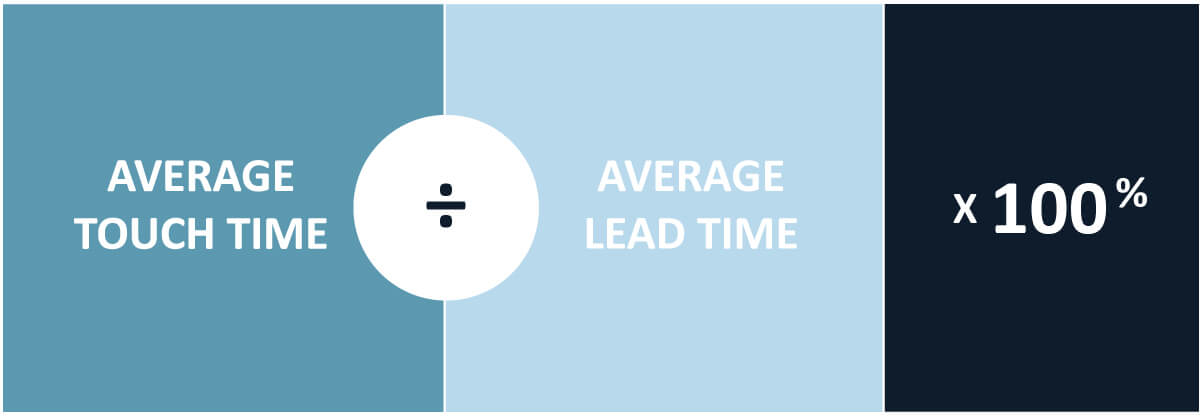
Step 2. We measure the average touch time for pieces of value that go through the system. This can be measured as actual working days or time in value add process steps.
You can use Customer Lead Time or System Lead Time in this calculation, but make sure you’re comparing apples with apples.
What’s the optimum flow efficiency?
Product development tends to be a balance between cost and delivery speed, and traditional (SDLC) models have generally prioritised cost.
We tend to observe flow efficiencies of less than 10% in most SDLC models – where work spends the majority of its time waiting for sign-offs or reviews. A flow distribution and efficiency of less than 5% is not uncommon.
Don’t make the mistake of assuming that a low flow efficiency is necessarily a bad thing – the target for flow efficiency will differ based on the nature of the system you’re working within.
Low flow efficiency systems: If I have a system with a very expensive step (e.g. a factory that requires components to be baked in a kiln that costs $1m to fire) then a low flow efficiency is economical. I don’t want to fire the kiln for each piece of work that goes through the system at a cost of $1m per unit, I want to wait until the kiln is full and then process all the pieces at once to reduce my unit cost.
High flow efficiency systems: If I have a system where responsiveness is critical (e.g. emergency services or support for high value customers) then I want a high flow efficiency. I am happy to leave system resources idle until I have a request and then deliver value as quickly as possible. I don’t mind if fire brigade members spend their whole day idle, providing that they’re on hand immediately when I need them.
At Elabor8 we recommend a target range of 25-40% flow efficiency and resource efficiency for product development, tending towards the higher side in hyper-competitive marketplaces where lead time is critical to business performance, and toward the lower side where there are expensive skills or equipment required in the process (e.g. physical product development, field testing, etc.).
Use the range as a guide only. In a critical Data Centre Migration project that our team helped deliver for a Sydney client using Kanban, we observed flow efficiency of greater than 60%. The team was highly specialised and was deliberately coached to focus on finishing rather than starting work. Higher flow efficiency was contextually appropriate on this project and it was delivered ahead of schedule without the normal trauma associated with cutover.
Improving your flow efficiency
Organisations need to be aware that creating a lean flow efficiency requires investment in reducing transaction costs so that they can release in small chunks without breaking system economics. In our experience with large organisations, the initial constraint in the system tends to be in systems integration and release management (the ‘kiln’ scenario from the example above).
Don’t try to start delivering smaller batches of value through your product development factory without also investing in alleviating your technology constraints through the implementation of test automation, continuous integration, test driven development and DevOps culture.
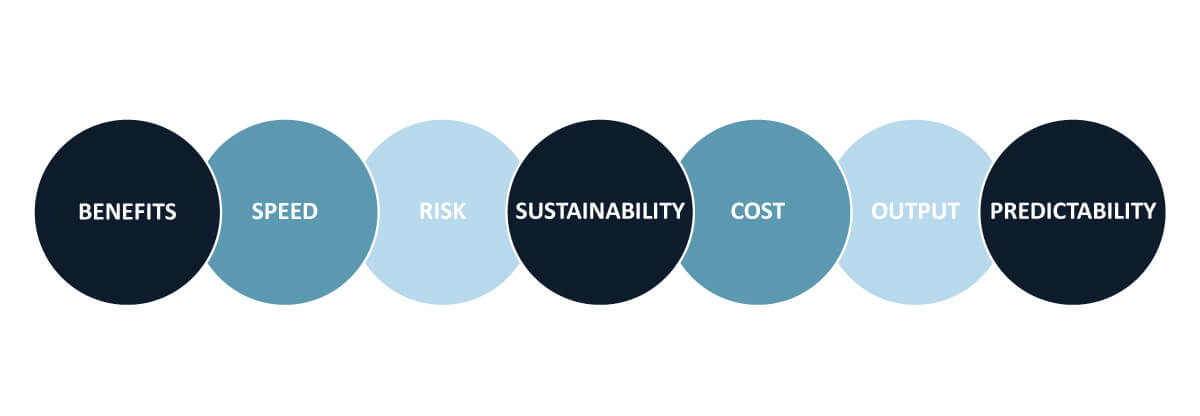
Measuring flow efficiency is the first step towards improving lead times in the context of your business processes. Beyond this, it forms a key plank of the “speed” dimension in our recommended framework to optimise product development.